Difference between revisions of "User:Aks"
Jump to navigation
Jump to search
| (4 intermediate revisions by the same user not shown) | |||
| Line 12: | Line 12: | ||
3-D Visualization: Klein Bottle | 3-D Visualization: Klein Bottle | ||
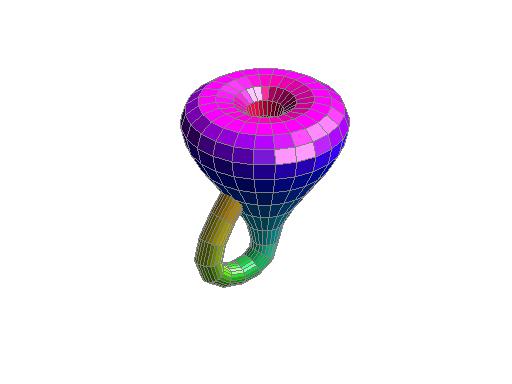
This one is my favorite because it created a cool image and I was able to make out what most of the code was doing. | This one is my favorite because it created a cool image and I was able to make out what most of the code was doing. | ||
| − | [[ | + | |
| + | ===Image of Klein Bottle=== | ||
| + | [[Image:Klein Bottle.jpg|frame|none|alt=alt text]] | ||
===Code used to generate Klein Bottle=== | ===Code used to generate Klein Bottle=== | ||
| − | n = 12; | + | n = 12; |
| − | a = .2; % the diameter of the small tube | + | a = .2; % the diameter of the small tube |
| − | c = .6; % the diameter of the bulb | + | c = .6; % the diameter of the bulb |
| − | t1 = pi/4 : pi/n : 5*pi/4; % parameter along the tube | + | t1 = pi/4 : pi/n : 5*pi/4; % parameter along the tube |
| − | t2 = 5*pi/4 : pi/n : 9*pi/4; % angle around the tube | + | t2 = 5*pi/4 : pi/n : 9*pi/4; % angle around the tube |
| − | u = pi/2 : pi/n : 5*pi/2; | + | u = pi/2 : pi/n : 5*pi/2; |
| − | [X,Z1] = meshgrid(t1,u); | + | [X,Z1] = meshgrid(t1,u); |
| − | [Y,Z2] = meshgrid(t2,u); | + | [Y,Z2] = meshgrid(t2,u); |
| − | + | % The handle | |
| − | % The handle | + | len = sqrt(sin(X).^2 + cos(2*X).^2); |
| − | len = sqrt(sin(X).^2 + cos(2*X).^2); | + | x1 = c*ones(size(X)).*(cos(X).*sin(X)... |
| − | x1 = c*ones(size(X)).*(cos(X).*sin(X) ... | ||
- 0.5*ones(size(X))+a*sin(Z1).*sin(X)./len); | - 0.5*ones(size(X))+a*sin(Z1).*sin(X)./len); | ||
| − | y1 = a*c*cos(Z1).*ones(size(X)); | + | y1 = a*c*cos(Z1).*ones(size(X)); |
| − | z1 = ones(size(X)).*cos(X) + a*c*sin(Z1).*cos(2*X)./len; | + | z1 = ones(size(X)).*cos(X) + a*c*sin(Z1).*cos(2*X)./len; |
| − | handleHndl=surf(x1,y1,z1,X); | + | handleHndl=surf(x1,y1,z1,X); |
| − | set(handleHndl,'EdgeColor',[.5 .5 .5]); | + | set(handleHndl,'EdgeColor',[.5 .5 .5]); |
| − | hold on; | + | hold on; |
| − | + | % The bulb | |
| − | % The bulb | + | r = sin(Y) .* cos(Y) - (a + 1/2) * ones(size(Y)); |
| − | r = sin(Y) .* cos(Y) - (a + 1/2) * ones(size(Y)); | + | x2 = c * sin(Z2) .* r; |
| − | x2 = c * sin(Z2) .* r; | + | y2 = - c * cos(Z2) .* r; |
| − | y2 = - c * cos(Z2) .* r; | + | z2 = ones(size(Y)) .* cos(Y); |
| − | z2 = ones(size(Y)) .* cos(Y); | + | bulbHndl=surf(x2,y2,z2,Y); |
| − | bulbHndl=surf(x2,y2,z2,Y); | + | set(bulbHndl,'EdgeColor',[.5 .5 .5]) |
| − | set(bulbHndl,'EdgeColor',[.5 .5 .5]) | + | colormap(hsv); |
| − | + | axis vis3d | |
| − | colormap(hsv); | + | view(-37,30); |
| − | axis vis3d | + | axis off |
| − | view(-37,30); | + | light('Position',[2 -4 5]) |
| − | axis off | + | light |
| − | light('Position',[2 -4 5]) | + | hold off |
| − | light | ||
| − | hold off | ||
Latest revision as of 15:22, 22 September 2011
Hello!!
Contents
My Engineering Grand Challenge Article
Reverse Engineering the Brain, Sally Adee, IEEE Spectrum, updated June 2008, accessed 21 September 2011 (Reverse Engineering the Brain)
Phonetic Pronunciation of "Andrew Shim"
an-droo shim (not sheem)
My favorite MATLAB demonstration
3-D Visualization: Klein Bottle This one is my favorite because it created a cool image and I was able to make out what most of the code was doing.
Image of Klein Bottle
Code used to generate Klein Bottle
n = 12;
a = .2;                         % the diameter of the small tube
c = .6;                         % the diameter of the bulb
t1 = pi/4 : pi/n : 5*pi/4;      % parameter along the tube
t2 = 5*pi/4 : pi/n : 9*pi/4;    % angle around the tube
u  = pi/2 : pi/n : 5*pi/2;
[X,Z1] = meshgrid(t1,u);
[Y,Z2] = meshgrid(t2,u);
% The handle
len = sqrt(sin(X).^2 + cos(2*X).^2);
x1 = c*ones(size(X)).*(cos(X).*sin(X)...
   - 0.5*ones(size(X))+a*sin(Z1).*sin(X)./len);
y1 = a*c*cos(Z1).*ones(size(X));
z1 = ones(size(X)).*cos(X) + a*c*sin(Z1).*cos(2*X)./len;
handleHndl=surf(x1,y1,z1,X);
set(handleHndl,'EdgeColor',[.5 .5 .5]);
hold on;
% The bulb
r = sin(Y) .* cos(Y) - (a + 1/2) * ones(size(Y));
x2 = c * sin(Z2) .* r;
y2 = - c * cos(Z2) .* r;
z2 = ones(size(Y)) .* cos(Y);
bulbHndl=surf(x2,y2,z2,Y);
set(bulbHndl,'EdgeColor',[.5 .5 .5])
colormap(hsv);
axis vis3d
view(-37,30);
axis off
light('Position',[2 -4 5])
light
hold off
